/Trenton%20Systems%20Circular%20Logo-3.png?width=50&height=50&name=Trenton%20Systems%20Circular%20Logo-3.png "Trenton Systems Circular Logo-3")
Share this
by Will Shirley on Oct 30, 2017 8:22:37 AM
GPGPU Compute Scales Excellently When Properly Deployed
GPGPU (General Purpose Graphics Processing Unit) computing has been around for more than a decade now, and many people in and out of the computing industry know that adding a GPU to a system can accelerate computing tasks such as simulations and factorization.
I’ve been evangelizing the benefits of GPGPU compute acceleration to customers for years, but I’ve never come up with a concrete way to illustrate how well performance scales linearly when you add GPUs to a properly compatible workflow.
Until now.
Folding@Home
Several weeks ago, I rediscovered a project that originally piqued my interest in high performance computing, Folding@Home.
One of the original distributed computing projects alongside storied stalwarts SETI@Home and GIMPS, “F@H” allows users to donate their spare computer processing power to simulate protein folding, or to test out new drug designs. It is thought that protein misfolding is a significant contributing factor in many diseases, namely, Alzheimer’s and many forms of cancers.
Folding@Home is significant in that it helped pioneer GPGPU accelerated scientific computing, deploying the first GPU-enabled client in 2006, and pushing the boundaries of distributed computing in a variety of ways.
Since then, GPU clients of the project have grown to be the most powerful contributors to the project, owing to the highly-parallelizable nature of the Markov State Models that F@H uses to simulate protein folding.
Part of the reason, in my opinion, that Folding@Home has remained so popular since its release in 2000 is that the project tracks and rewards contributions through a points system that is made freely available for 3rd parties to track and graph.
In addition, the client can join “Teams” that can collectively compete against each other. For the purposes of this experiment, we’ll be using the data collated by the long-running Extreme Overclocking tracker under the moniker TrentonSystems.
What are we testing?
| TEST RIG | ||
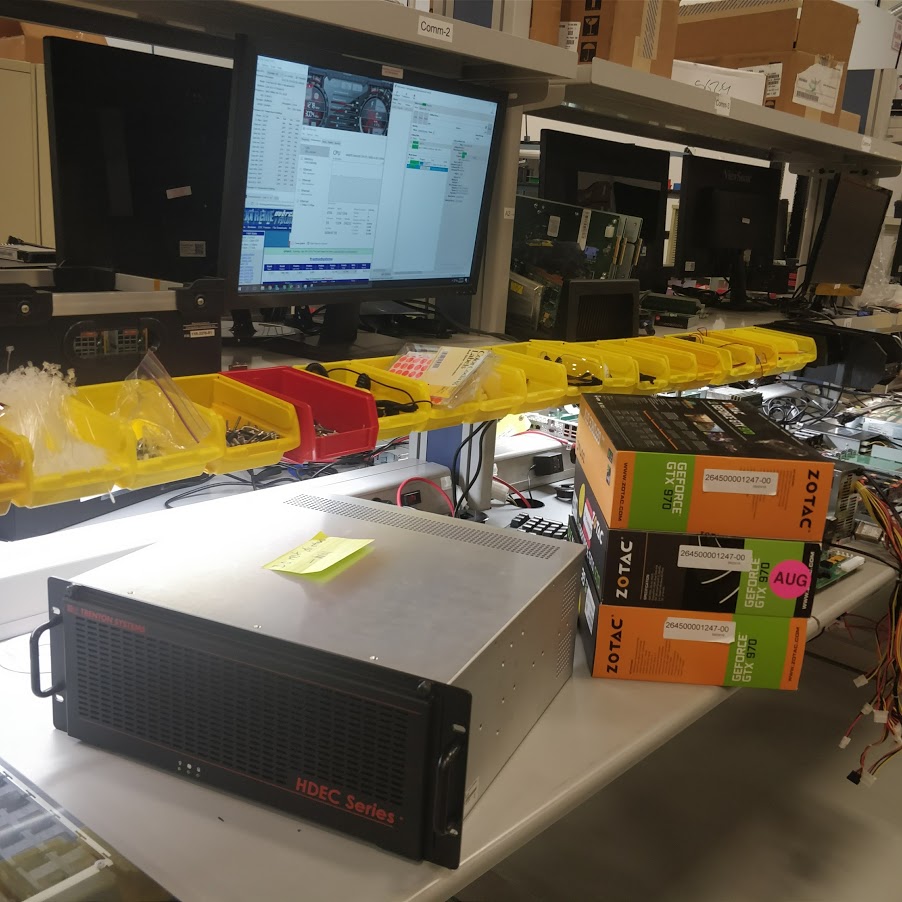
| Chassis | THS4086, 4U HDEC Series computer |
16.25” depth, front access hot-swap fans |
| Host Board | HEP8225 host board |
Dual Xeon E5-2680 v4 (Broadwell) 28 cores/56 threads |
| Backplane | HDB8228 backplane | 8 Slots, 4@ Gen3 x16, 4@ Gen3 x4 |
| Power Supply | 860w ATX | Higher wattages available |
| OS | Windows Server 2016 Standard | GUI is installed |
| Storage | Emphase 25GB Industrial SSD | SATA/600 |
| GPUs | Geforce GTX 970 | Zotac brand, 4GB DDR5, stock clocks |
This platform is ideal in that it can accommodate 4 double-wide GPUs without PCIe switches, owing to the 80 lanes of PCIe passed to the backplane through HDEC architecture, thus, when GPUs are added to the mix, we should have perfect performance scaling.
Methodology
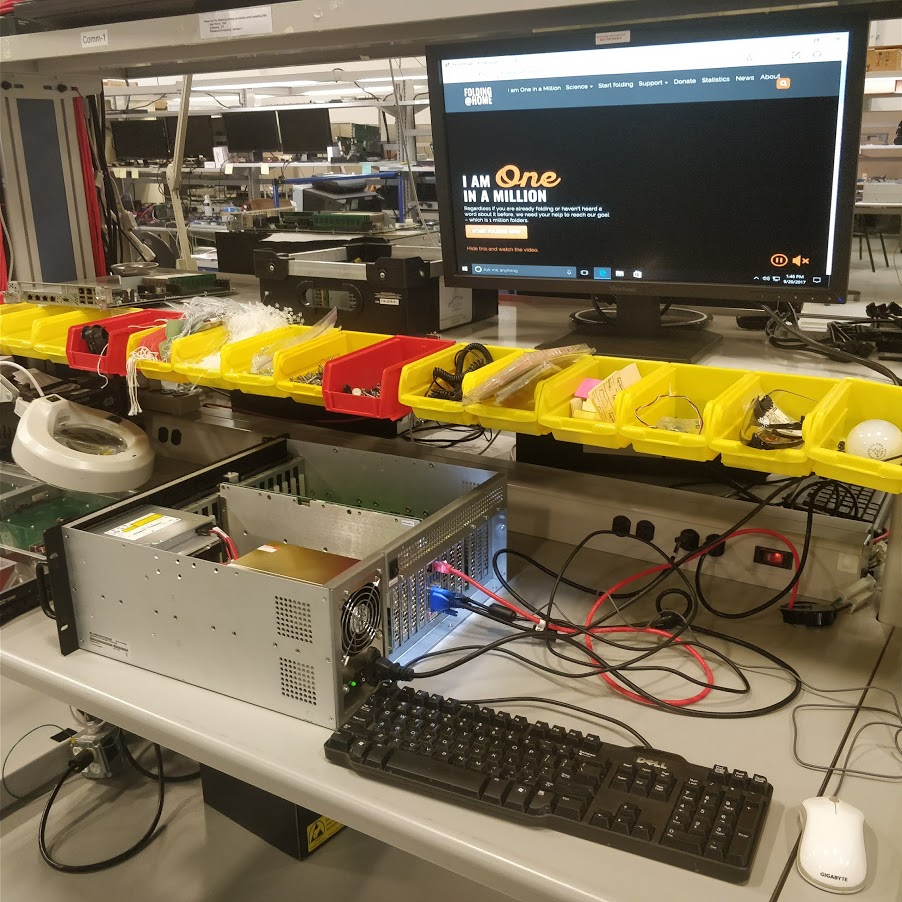
A fresh copy of Windows Server 2016 was installed and only the drivers necessary to bring the system up, in addition to CoreTemp to monitor processor temperatures, MSI’s Afterburner program for GPU monitoring, and the Folding@Home client.
Testing methodology was to obtain a baseline score with processors only for 24 hours. Once that was obtained, I shut down the system and added an additional GPU as close to every 24 hours as was feasible.
Note: The reasoning behind the 24-hour test cycle is the fact that not all Work Units that the project is currently computing are created equally; some are far more difficult and require up to 6+ hours of continuous compute time. Others may take as little as an hour on a GPU and the F@H stats are only tabulated every 3 hours. 24 hours should provide a reasonable sample size to be confident in the data even with the variations.
The system was started at 1600 on September 20, 2017 for the processor only run.
Then, as closely as possible to a consistent 24 hours, the system has its worker threads paused, the system was shut down, and additional graphics cards were added.
The system was started at 1600 on September 20, 2017 for the processor only run.
|
Daily Production |
Notes |
|
|
9/20/17 |
5884.00 |
~8 hours of CPU only time |
|
9/21/17 |
12911.00 |
~16 hours of CPU only time, added GPU at 1600 |
|
9/22/17 |
31762.00 |
|
|
9/23/17 |
61596.00 |
|
|
9/24/17 |
65248.00 |
Downtime & corrupt workunits, had to reset data buffer due to GPU config error. |
|
9/25/17 |
102097.00 |
Added GPU 2 in the afternoon |
|
9/26/17 |
117731.00 |
Added GPU 3 in the afternoon |
|
9/27/17 |
143743.00 |
Added GPU 4 in the afternoon |
|
9/28/17 |
186532.00 |
|
|
9/29/17 |
212833.00 |
|
|
9/30/17 |
211685.00 |
|
|
10/1/17 |
213520.00 |
|
Figure 2 Annotated Chart
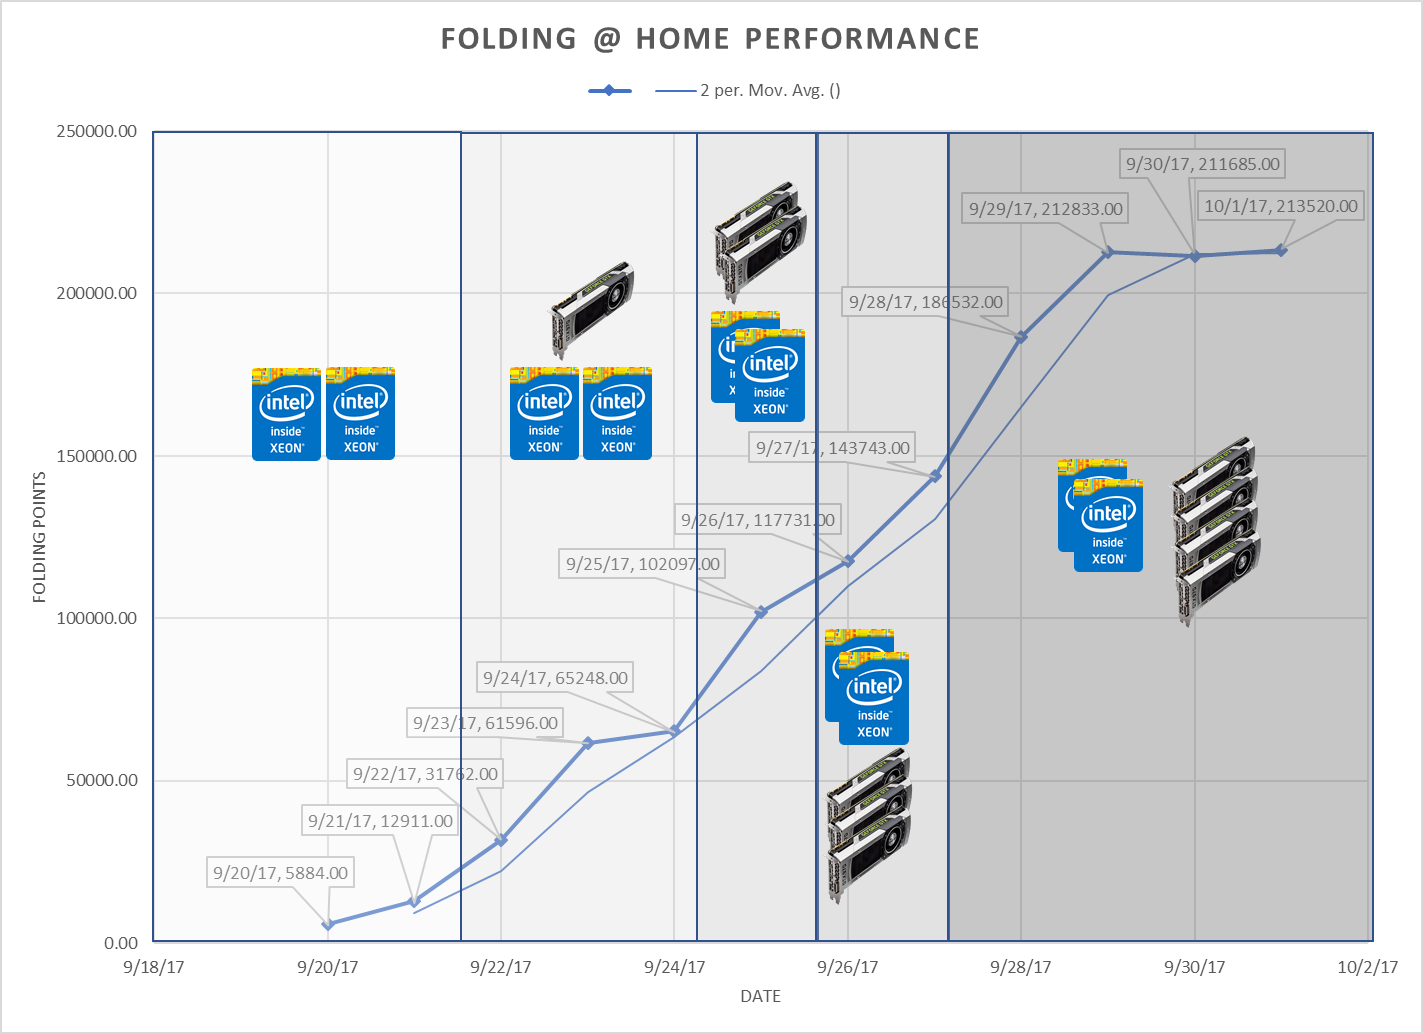
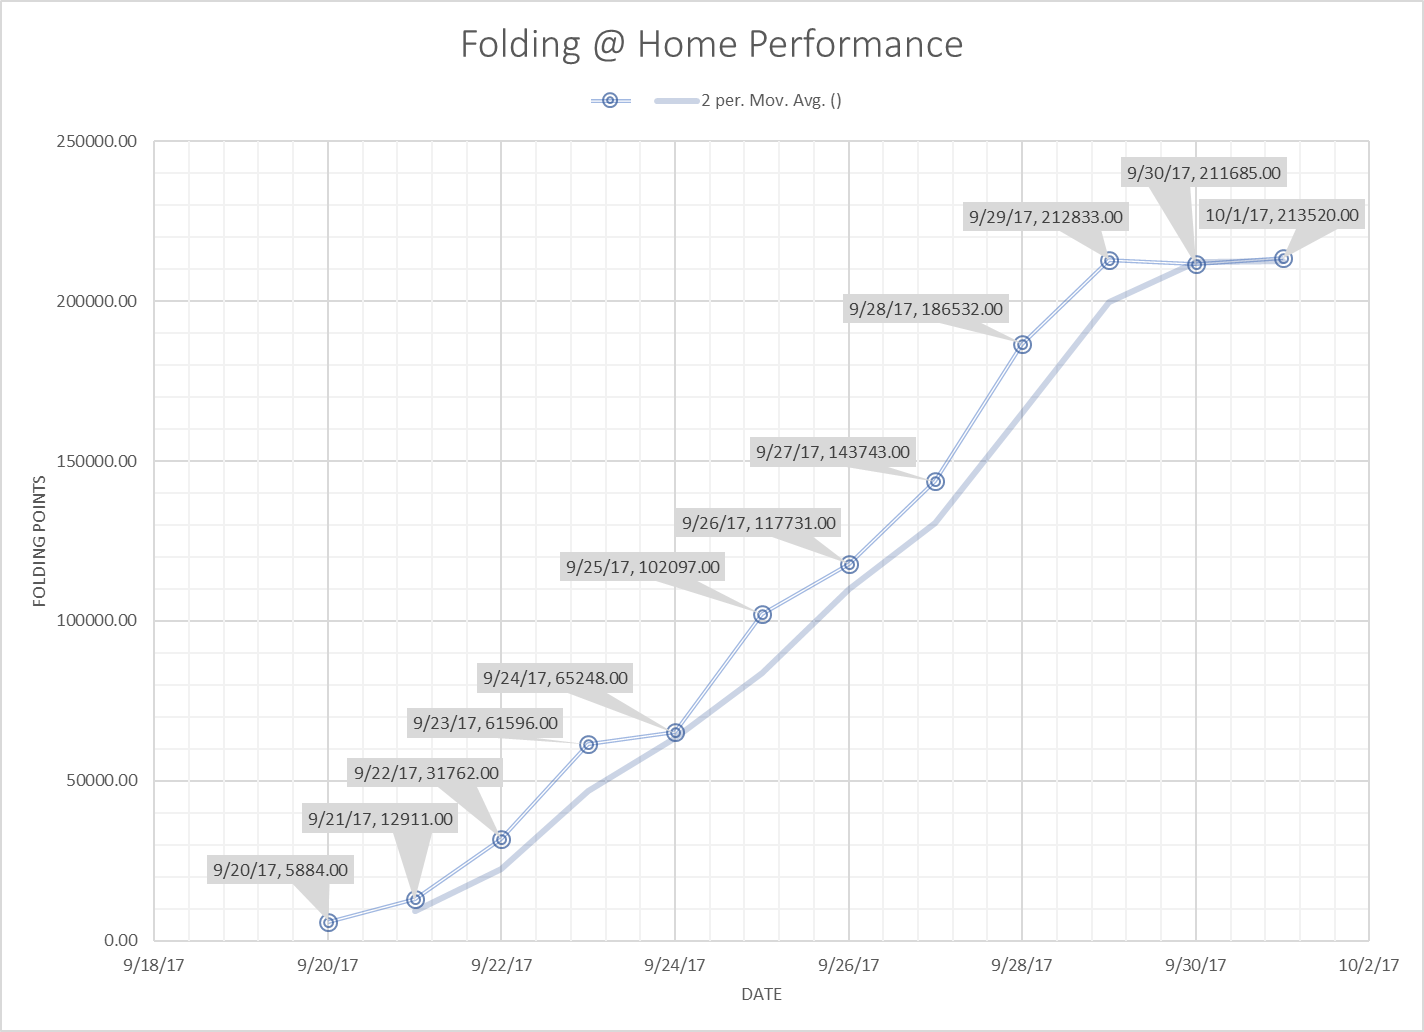
Figure 3, Unannotated Chart
Analysis and Conclusions
The addition of just one GPU increased the performance of the overall system immensely, in and of itself as illustrated in the period between 9/22 and 9/24, demonstrating just how much better a GPU-powered system is at being able to crunch large problems.
In fact, if you add up the totals for 9/20 and 9/21, and compare to the 2-day totals for the 1-GPU configuration, is nearly a 400% performance increase. Additionally, performance from 1 GPU to 4 GPUs is an astounding 1000% increase in computing power.
With that kind of potential increase available, every high-performance computing or simulation system designer should be, at least, considering how they can leverage GPGPUs to accelerate their application.

Trenton Systems is a NVIDIA Preferred Solution partner, so we have the expertise and factory backing to help you deploy a GPGPU-accelerated compute solution into your application.
Interested in learning more? Get in touch to discover how Team Trenton can arm you with the right tools to take on any mission with speed, efficiency, and maximum protection.
No Comments Yet
Let us know what you think